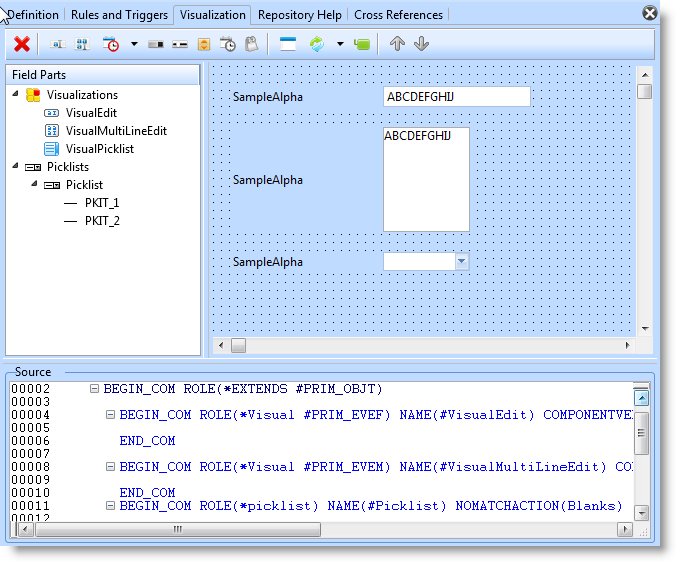
To add another visualization for the field, use the toolbar on the tab.
When you select one of the visualizations, it is added to the field's component definition. The new visualization becomes visible in the design view:

And in the Source view a definition is added for the new visualization.
BEGIN_COM ROLE(*Visual #PRIM_EVTB) NAME(#VisualTrackBar) HEIGHT(19) WIDTH(209)
END_COM
The component defined for the Role property defines the type of visualization. These are the Roles for the available visualizations:
|
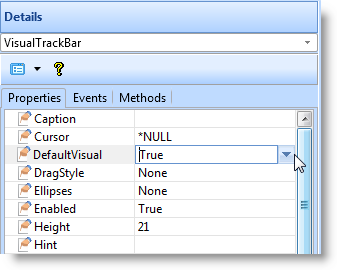
If you define several visualizations for a field and If you want to make one of them the default visualization of the field when it is added to another component, set the DefaultVisual property of the visualization to True:
In this picture the track bar visualization is made the default:

Only one of the field's visualizations can be the default visualization.
You need to save the updated definition for the field before you can use the visualizations you have defined.