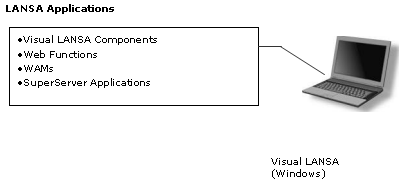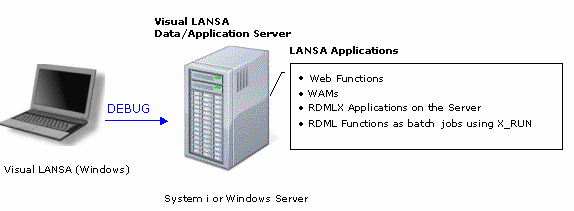
The Visual LANSA Development Environment has extensive interactive debugging facilities to debug applications developed with various Visual LANSA Technologies including:
Note: For IBM i, only RDMLX applications can be debugged using the Visual LANSA Editor. RDML applications can only be debugged using an IBM i display device (that is, the green screen).
Interactive debugging allows LANSA applications to be debugged at the RDML source code level. You can single-step through RDML commands, set breakpoints at individual RDML commands, and examine and change field values whenever execution is paused.
There are two modes of interactive debugging:
From the setup point of view, there is no difference between local and remote debugging. The Visual LANSA Debug Service supports debugging in the Visual LANSA development environment for various scenarios.
For more information about setting up the development environment for interactive debugging, refer to Debug in the LANSA Settings in the Visual LANSA User Guide.

In local debugging mode, the LANSA application being developed is running alongside Visual LANSA on the same computer.
This is also the case even if the LANSA application being developed and the Visual LANSA for debugging belong to two different Visual LANSA installations on the same computer although that is not that a common scenario.
While Visual LANSA runs only on Windows, the LANSA application being developed must also be running on Windows in this mode.

In remote debugging mode, the LANSA application being developed is running on a data/application server that is different to the computer where Visual LANSA is running.
If the LANSA application being developed is running on a non-Windows platform, this is the only debugging mode available.