In this step you will simply review some of the basic debug features.
1. Select the Breakpoints tab on the bottom of the editor. If necessary open the Breakpoints tab from the Home ribbon, Tabs menu.
You have no break points set at this time, so no items are listed:

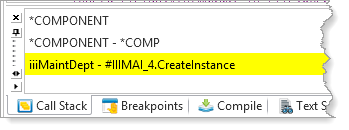
2. Use the Tabs menu to open the Call Stack tab at the bottom of the editor:

The Call Stack tab lists all programs (processes, functions, components and reusable parts) in the order that they have been invoked.
3. Press the F8 (Step Into) key once, and you will see that the highlighted line in the editor advances to the next line to be executed (SET command). This command has not been executed yet.