In this step you will simply review the main debug features.
1. The Call Stack tab will be open at the bottom of the editor:

The Call Stack tab lists all programs (web page, reusable part and other components) in the order that they have been invoked. If necessary open Call Stack from the Home ribbon / Tabs menu.
2. Press F8 (Step Into) to advance to the next executable statement. Step Into executes one line at a time. The Endroutine will be highlighted:

3. Press F8 again. Since there are no breakpoints set at the moment, the web page will continue execution and will be displayed in the browser. Switch to the browser, which is now back in control and debug is waiting for input from the web page. Enter a department code and click the Fetch button. Debug will again break at the first executable statement which is the Fetch.Click event:

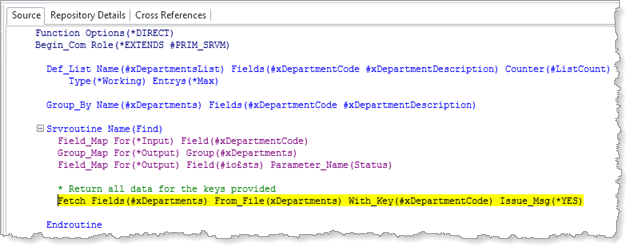
4. This time press F5 Continue Execution. This will continue execution of the web page until a breakpoint is reached, or to the first executable in the next program to run (if there is one). In this case, the Fetch method in the web page executes the Find srvroutine in the xDepartments Data Server module. The server module will open in the editor and will break at the FETCH Command in the Find srvroutine.

5. Press F5 and return to the browser. The department description will be displayed.
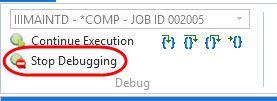
6. To stop debugging a web page use the button shown:
