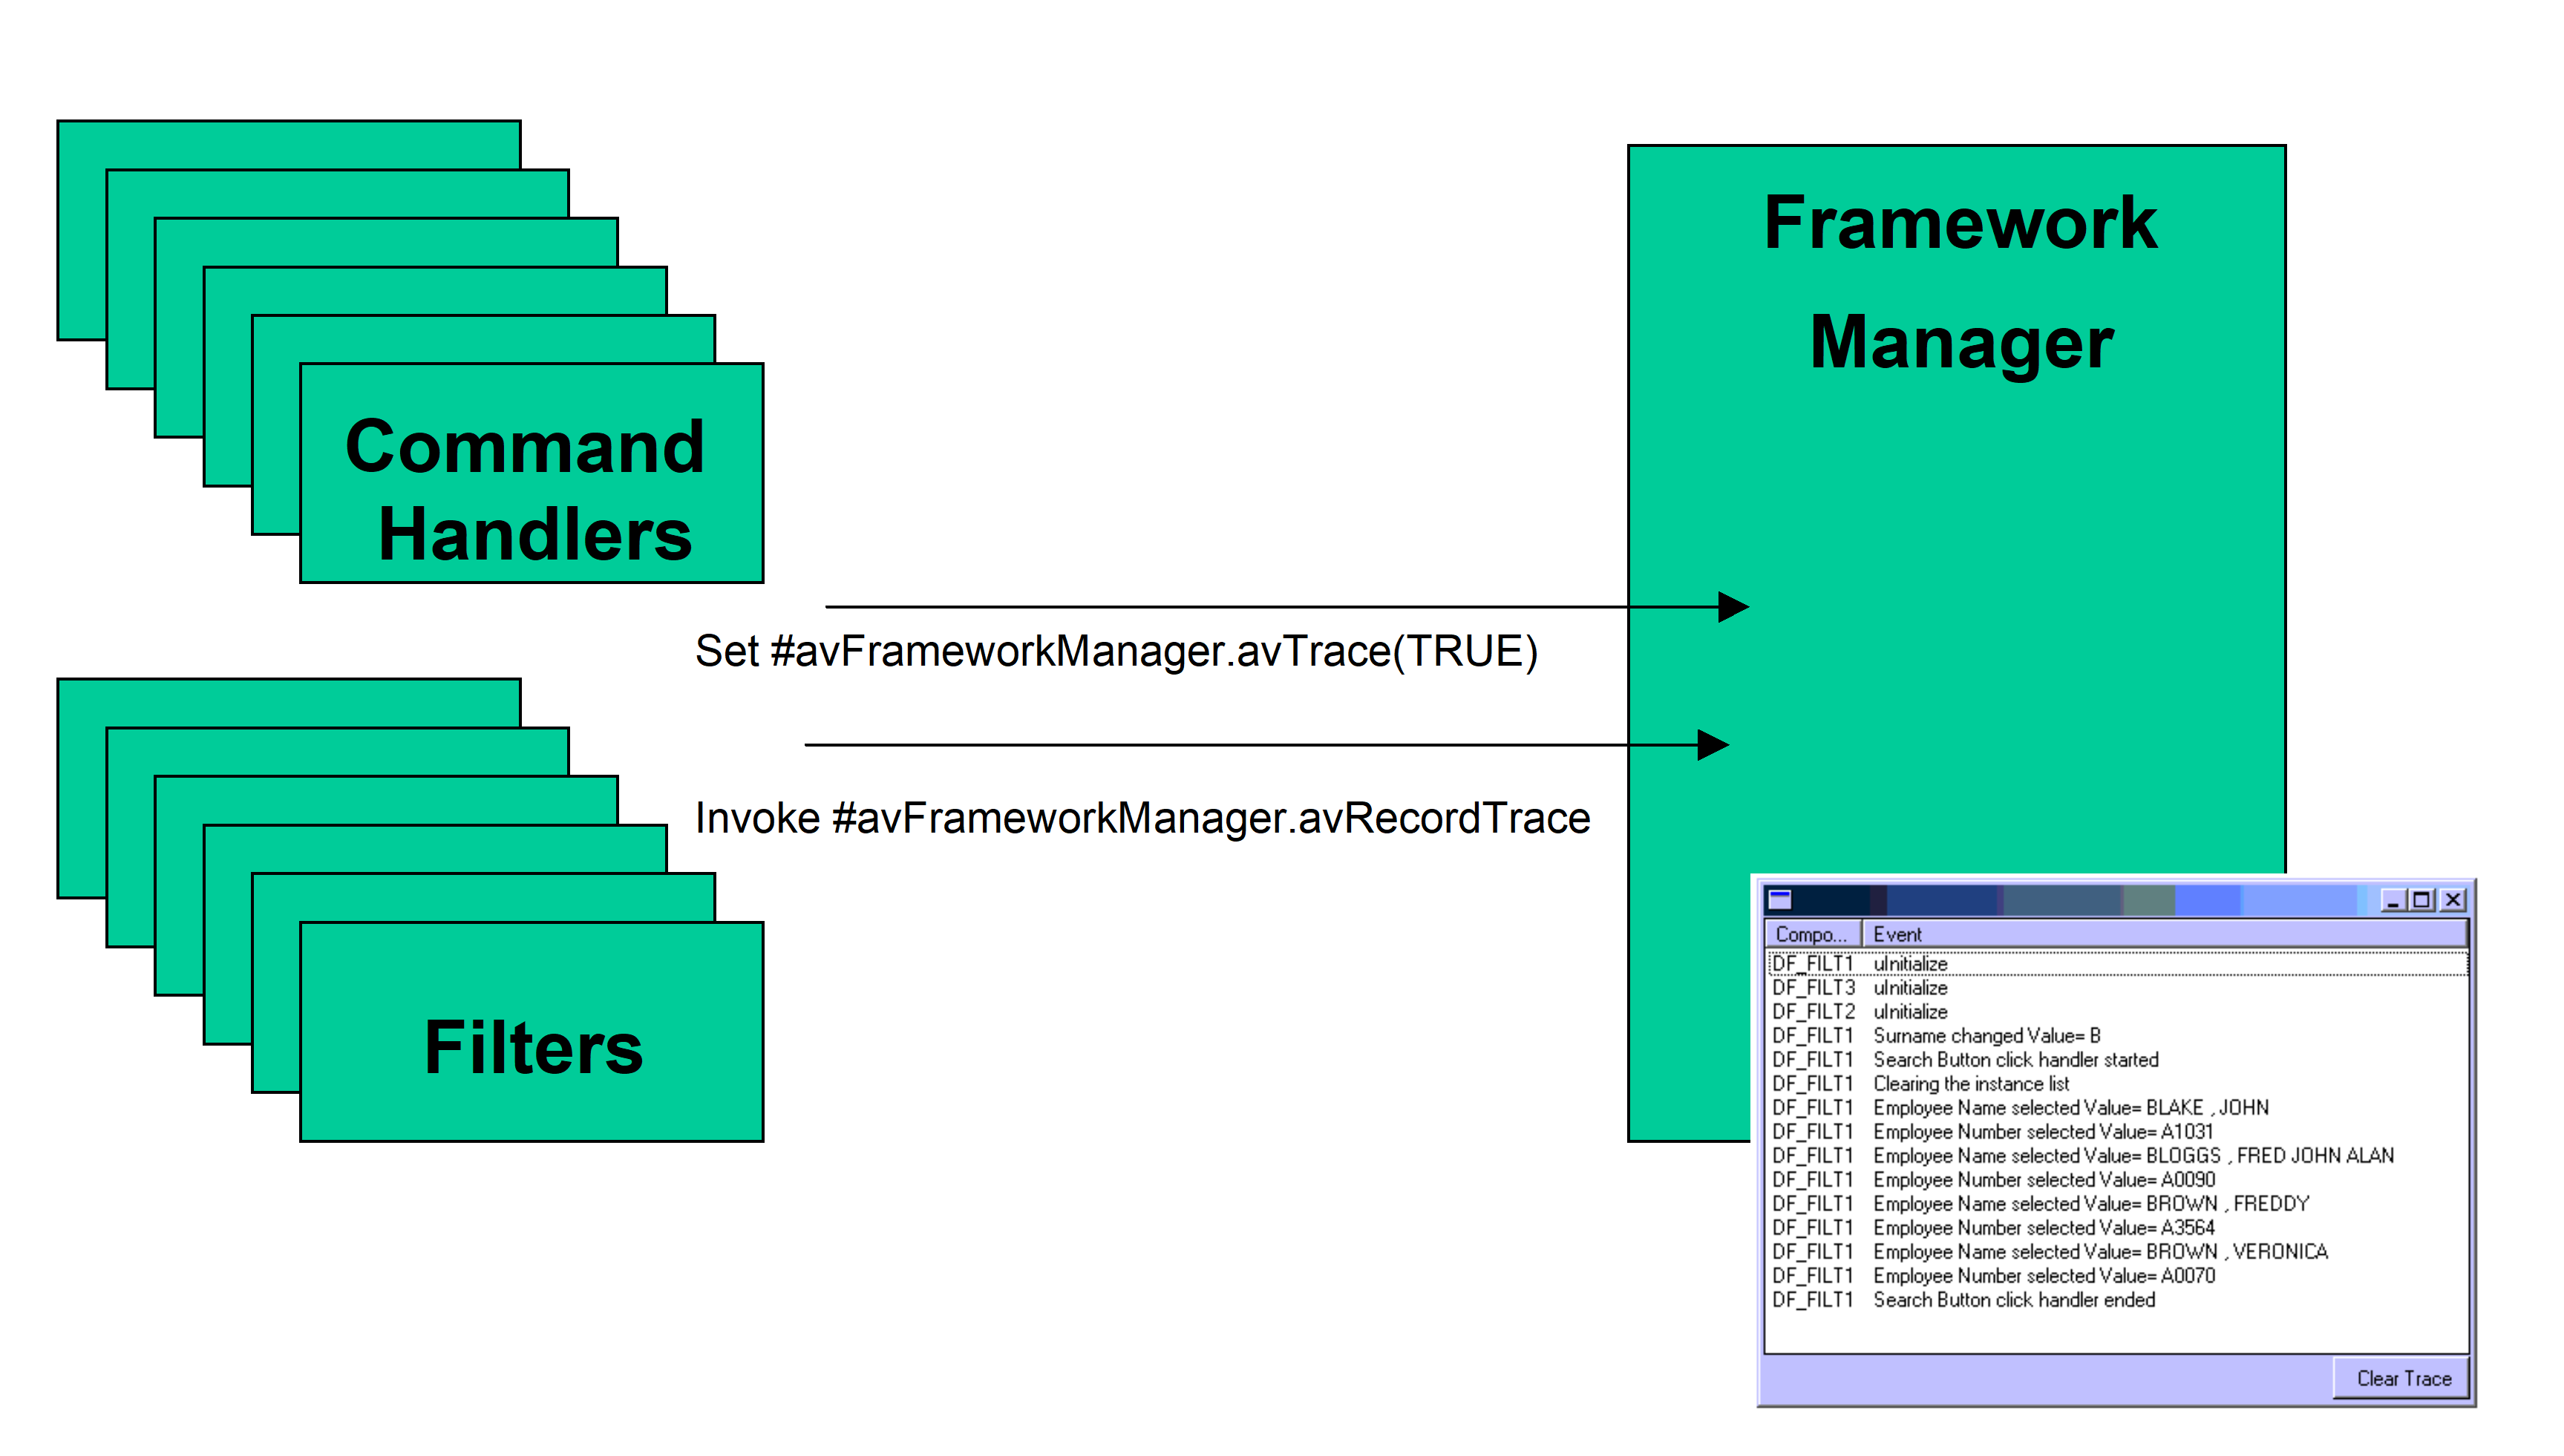

The Framework manager provides a basic tracing service to help you locate problems in your filters or command handlers. 
The tracing service can be used in conjunction with, or independently of, the normal LANSA application debugging and tracing facilities.
You can add tracing capabilities to your applications by using one or more of the three available avRecordTrace methods:
avRecordTrace is now used for almost all tracing:
Invoke #AvFrameworkManager.AvRecordTrace Component(#Com_Owner)
Event('The search button was clicked')
avRecordTraceAValue is still supported specifically for tracing alphanumeric values:
Invoke #AvFrameworkManager.AvRecordTraceAValue Component(#Com_Owner)
AValue(#Empno) Event('Employee selected')
avRecordTraceNValue is still supported specifically for tracing numeric values:
Invoke #AvFrameworkManager.AvRecordTraceNValue Component(#Com_Owner)
NValue(#Salary) Event('Salary found')
The avRecordTrace methods will do nothing at all until tracing is turned on.
This generally means that tracing operations can be left in your application with only minor performance overheads.
Tracing may be turned on and off programmatically by setting the avTrace property:
Set #AvFrameworkManager avTrace(TRUE)
Set #AvFrameworkManager avTrace(FALSE)
If you are using the Framework as a designer you can turn tracing on or off by using the (Framework) -> (Tracing) -> Application Level or System Level menu options at any time.
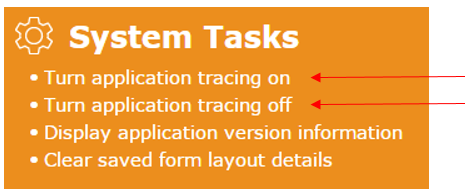
It is recommended that you put trace on and off commands into your own VLF applications. That allows you to capture trace details from your end-users. For example the shipped VLF-ONE demonstration has those options here:

The associated code is in the left slider pane DF_SLIDLB:
#avFrameworkManager.Avtrace := True
#avFrameworkManager.Avtrace := False