 Version 7.0
To help you understand the performance data collected by LANSA Composer, this section provides the following topics:
Understand Performance Data for IBM i Servers
Understand Performance Data for Windows Servers
When performance data collection is enabled, LANSA Composer collects performance data for each and every item or directive that is executed during the Processing Sequence run.
Those items and directives can include things such as Activities, Transformation Maps and calls to other Processing Sequences.
They can also include items such as loops, conditional directives (for example: IF, ELSE, CASE, OTHERWISE).
A number of items can have further items nested below them. For an example, an IF conditional directive usually "contains" a further set of directives that are executed when the IF condition is satisfied.
Such items are "block" items. When performance data is collected for them, the data reported for the "block" item (such as an IF directive or a loop) includes the performance data reported for each of the items nested below it.
It is very important to understand this in order to avoid "double-counting" of the performance data.
When the performance data is displayed in the Processing Sequence Performance Data window, such items are shown in grey. They are shown in grey to remind you that the performance metrics shown for that item include the performance data for all the items nested below it.
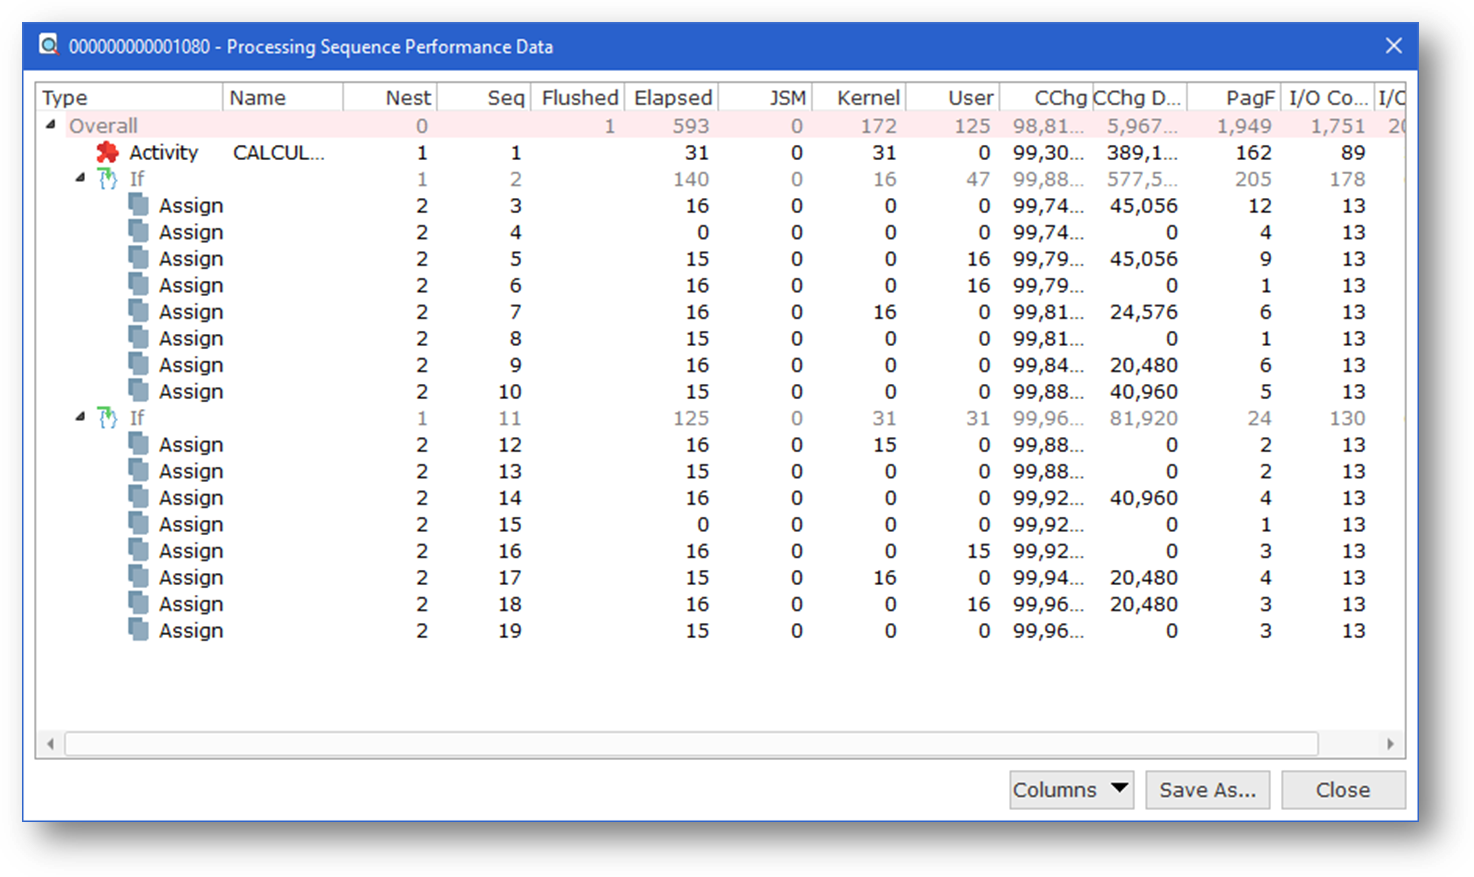
Although you might consider them as subtotals, this isn't strictly true. The totals of the items below it are unlikely to equal the values shown for the "block" item, since that item also performs processing on its own account. For example, an IF directive will expend some processing time and resources evaluating the condition specified.
When you Save the Performance Data for Further Analysis, the CSV file created contains a column labelled DXL7LEAF that you can use to identify the branches and the leaf items in the exported data. The value in that column specifies the number of "child" items nested below the item. If it is zero, then the item can be considered a "leaf" item.
The performance data items described below are common to both IBM i and Windows servers. Depending on whether your LANSA Composer server is running on IBM i or Windows, refer to one of the following topics for descriptions of the remaining performance data items:
Understand Performance Data for IBM i Servers
Understand Performance Data for Windows Servers
|
 Version 7.0