 Version 7.0
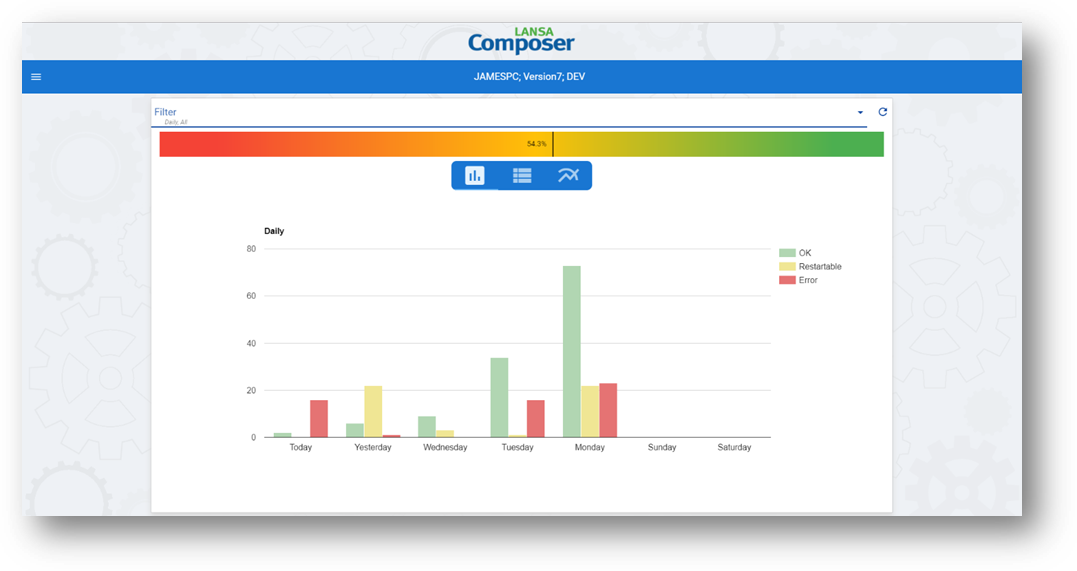
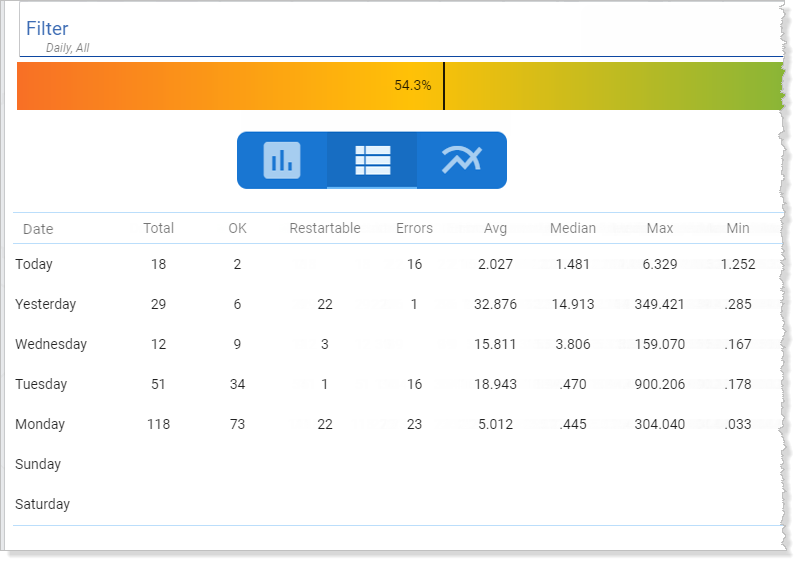
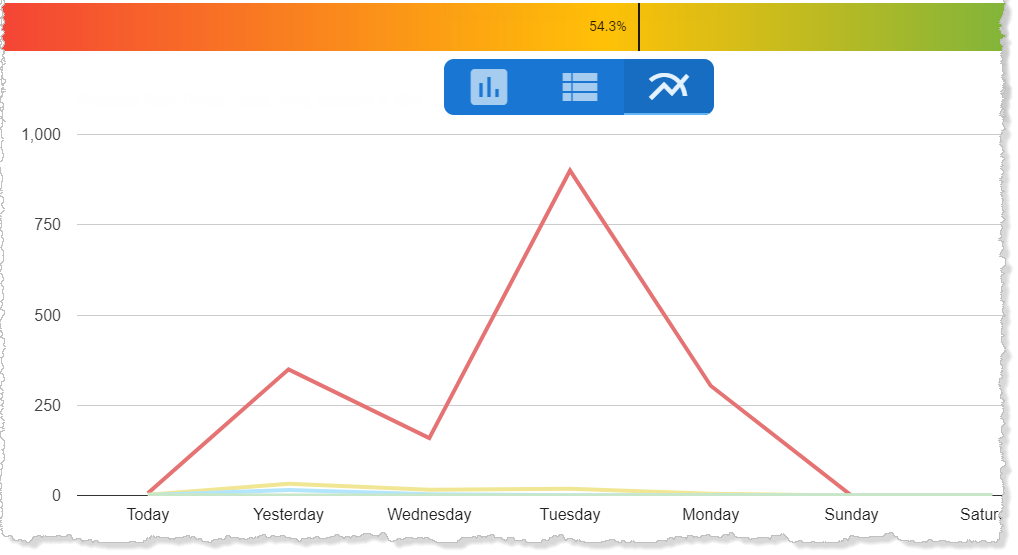
The Performance Monitor page of the Management Console presents an overview of processing sequence runs and run-times for the filtered period.
You can use the drop-down filters at the top of the page to choose whether to display a daily, weekly or monthly view and to choose processing sequence run statuses to display.
You can click or tap a segment of the graph to drill through to the Throughput Monitor Page for the corresponding period.
 Version 7.0